Free printable + Excel tracker
Biweekly Savings Plan
Paid every two weeks? Then you have 26 paydays a year, and this plan turns each one into a small, fixed transfer. Choose your goal, save that column's amount every payday, and tick the row.
Both are free. Tell us where to send them and they are in your inbox in a minute. The tracker adds up what you have saved and shows your finish date.
Goal
$1K to $10K
Paydays
26
Takes
1 year
Saving
from $38.46 a payday
How the biweekly plan works
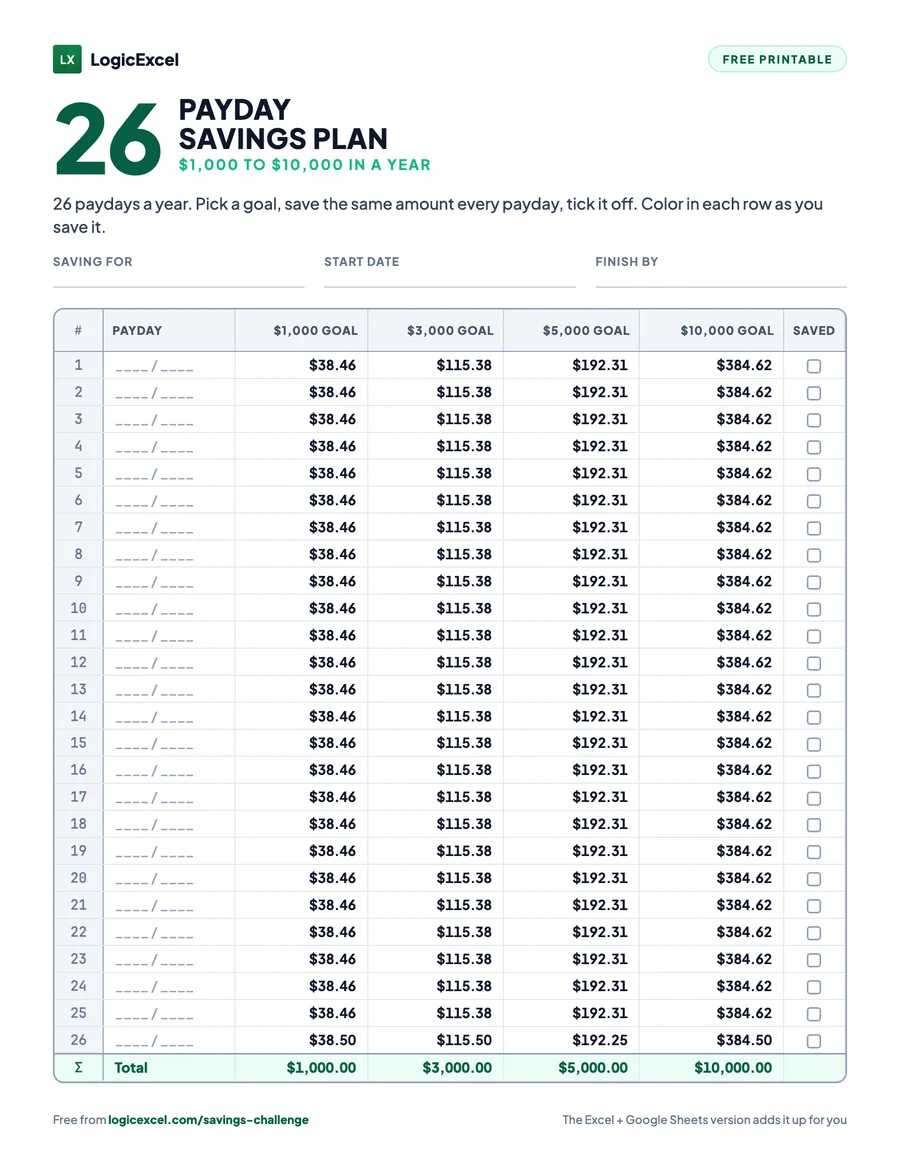
The chart has four goals side by side, so you can see what each one costs per paycheck before you commit: $38.46 for $1,000, $115.38 for $3,000, $192.31 for $5,000 and $384.62 for $10,000.
Print it, or open the tracker
Print the chart and put it where you will see it every day, or get the free tracker for Excel or Google Sheets. Write down what you are saving for.
Color a row each time you save
Every payday, move your column's amount to savings and tick the row. In the tracker, type x next to the payday.
Reach your goal in 1 year
Watch the chart fill up. The tracker shows what is saved, what is left and whether you are on pace, and the milestones on the chart mark each quarter of the way.
The biweekly savings chart
What each goal costs per paycheck, for all 26 paydays. Pick the column you can keep up, and the total arrives in a year.
| Payday | $1,000 goal | $3,000 goal | $5,000 goal | $10,000 goal |
|---|---|---|---|---|
| 1 | $38.46 | $115.38 | $192.31 | $384.62 |
| 2 | $38.46 | $115.38 | $192.31 | $384.62 |
| 3 | $38.46 | $115.38 | $192.31 | $384.62 |
| 4 | $38.46 | $115.38 | $192.31 | $384.62 |
| 5 | $38.46 | $115.38 | $192.31 | $384.62 |
| 6 | $38.46 | $115.38 | $192.31 | $384.62 |
| 7 | $38.46 | $115.38 | $192.31 | $384.62 |
| 8 | $38.46 | $115.38 | $192.31 | $384.62 |
| 9 | $38.46 | $115.38 | $192.31 | $384.62 |
| 10 | $38.46 | $115.38 | $192.31 | $384.62 |
| 11 | $38.46 | $115.38 | $192.31 | $384.62 |
| 12 | $38.46 | $115.38 | $192.31 | $384.62 |
| 13 | $38.46 | $115.38 | $192.31 | $384.62 |
| 14 | $38.46 | $115.38 | $192.31 | $384.62 |
| 15 | $38.46 | $115.38 | $192.31 | $384.62 |
| 16 | $38.46 | $115.38 | $192.31 | $384.62 |
| 17 | $38.46 | $115.38 | $192.31 | $384.62 |
| 18 | $38.46 | $115.38 | $192.31 | $384.62 |
| 19 | $38.46 | $115.38 | $192.31 | $384.62 |
| 20 | $38.46 | $115.38 | $192.31 | $384.62 |
| 21 | $38.46 | $115.38 | $192.31 | $384.62 |
| 22 | $38.46 | $115.38 | $192.31 | $384.62 |
| 23 | $38.46 | $115.38 | $192.31 | $384.62 |
| 24 | $38.46 | $115.38 | $192.31 | $384.62 |
| 25 | $38.46 | $115.38 | $192.31 | $384.62 |
| 26 | $38.50 | $115.50 | $192.25 | $384.50 |
| Total | $1,000.00 | $3,000.00 | $5,000.00 | $10,000.00 |
The free tracker adds it up for you
The same plan as a spreadsheet, for Excel and Google Sheets. Type x (or the date) under an amount when you save it: the row turns green and the tab totals what you have saved, shows what is left, and tells you whether you are on pace and the day you will finish. It also has every other challenge, and a tab where you set your own goal and number of cells.
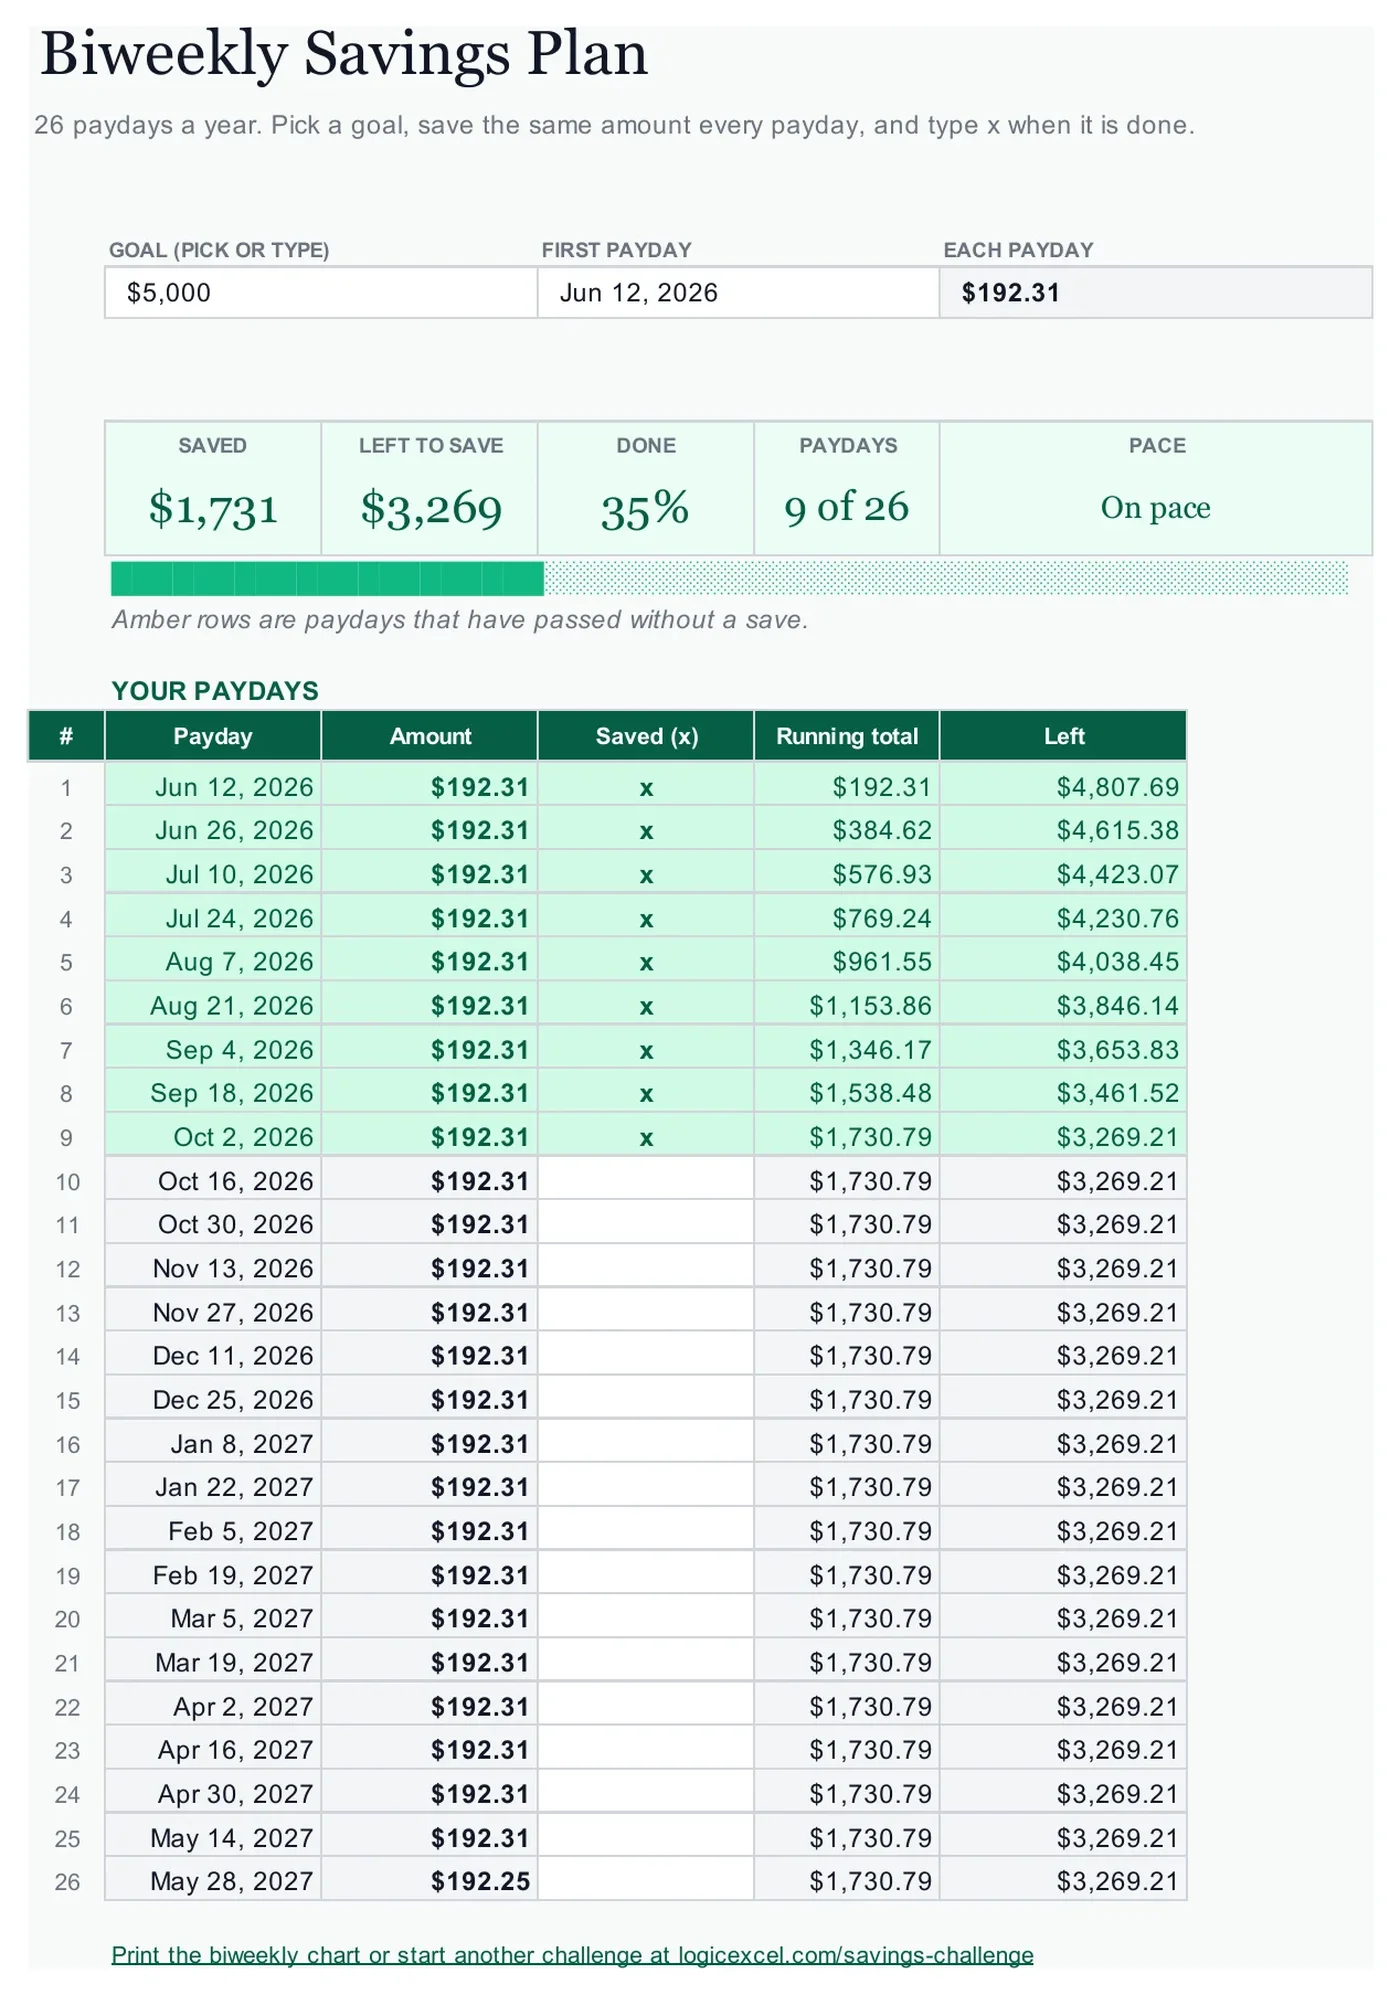
Curious how the green cells work? It is a two-minute idea: learn conditional formatting free, in a live spreadsheet in your browser.
Tips that make it stick
- Automate it: schedule the transfer for the morning of payday, before the money has a chance to go anywhere else.
- Most years have 26 paydays, but some have 27. Treat the extra one as a bonus row.
- Raise the goal later rather than sooner: start with $1,000 and move up a column once it feels easy.
Questions
How much do I save each payday?
With 26 paydays a year: $38.46 for $1,000, $115.38 for $3,000, $192.31 for $5,000, $384.62 for $10,000. The last payday is a few cents different so each column adds up to its goal exactly.
Is it really free?
Yes. The printable PDF and the Excel and Google Sheets tracker are both free. We email them to you, along with a few short tips to help you finish.
Does the tracker work in Google Sheets?
Yes. Choose Google Sheets when you get the tracker, and the email has a button that makes your own copy in your Google Drive in one click. The totals, the green cells and the pace all work there. In Excel it works on Windows and Mac, in any version from 2016.
What if I miss a week?
Nothing breaks. Color any cell you like the next time you save; the order does not matter. The tracker shows how many cells you are behind and moves your finish date, so you can catch up when you have room.
Where should I keep the money?
In a separate savings account, ideally a high-yield one, so you can see the total grow and you are not tempted to spend it. Move the money as you color the cell, so the chart and the account always match.
Can I start in the middle of the year?
Yes. Write your own start date on the chart, or type it into the tracker, and the finish date and pace follow from that day.
Ready to start?
Get the chart, pick your start date, and color the first row today.
Both are free. Tell us where to send them and they are in your inbox in a minute. The tracker adds up what you have saved and shows your finish date.
More savings challenges
$1,378
52-Week Savings Challenge
52 cells, 1 year
$1,000
$1,000 Savings Challenge
50 cells, 6 months
$5,000
$5,000 Savings Challenge
100 cells, 1 year
$10,000
$10,000 Savings Challenge
100 cells, 1 year
$1,000
90-Day Savings Challenge
90 cells, 3 months
Or compare all six challenges and get every printable in one PDF.